Output: Data artwork.
Topics: Data portrait, emotions.
Tools/Skills: Adobe Illustrator, Excel.
Data: Self-registered data.
Topics: Data portrait, emotions.
Tools/Skills: Adobe Illustrator, Excel.
Data: Self-registered data.
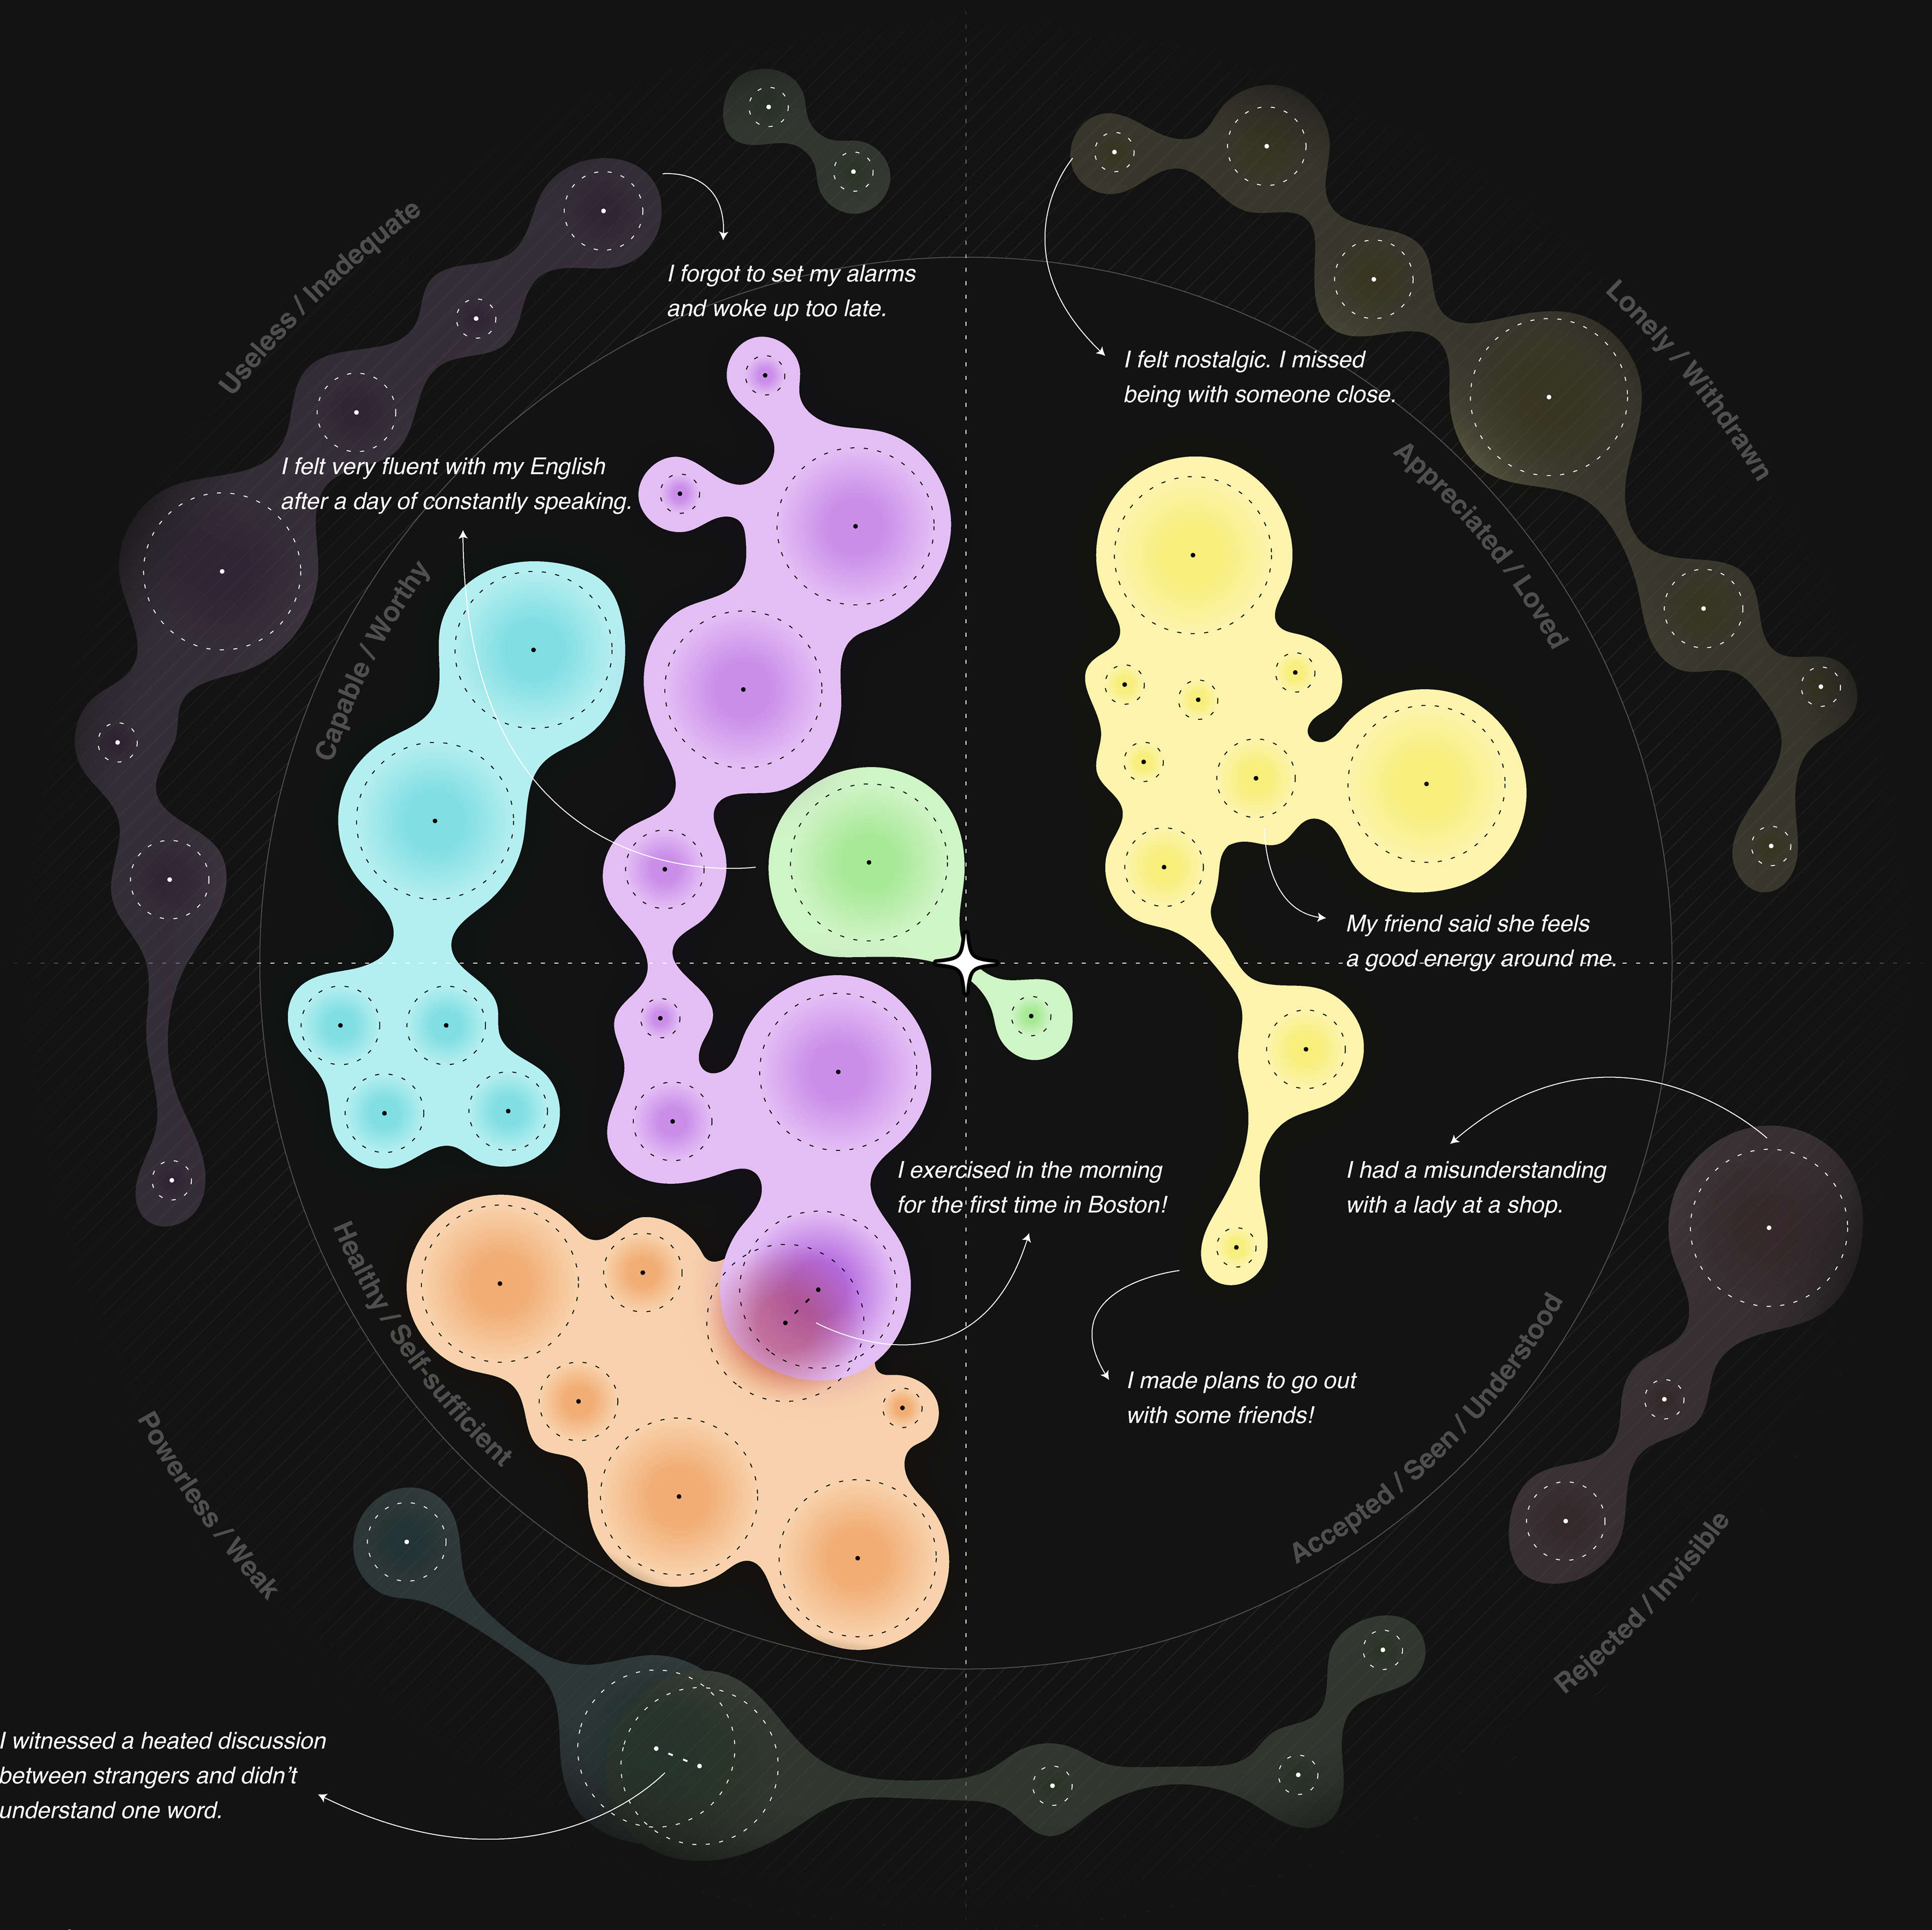
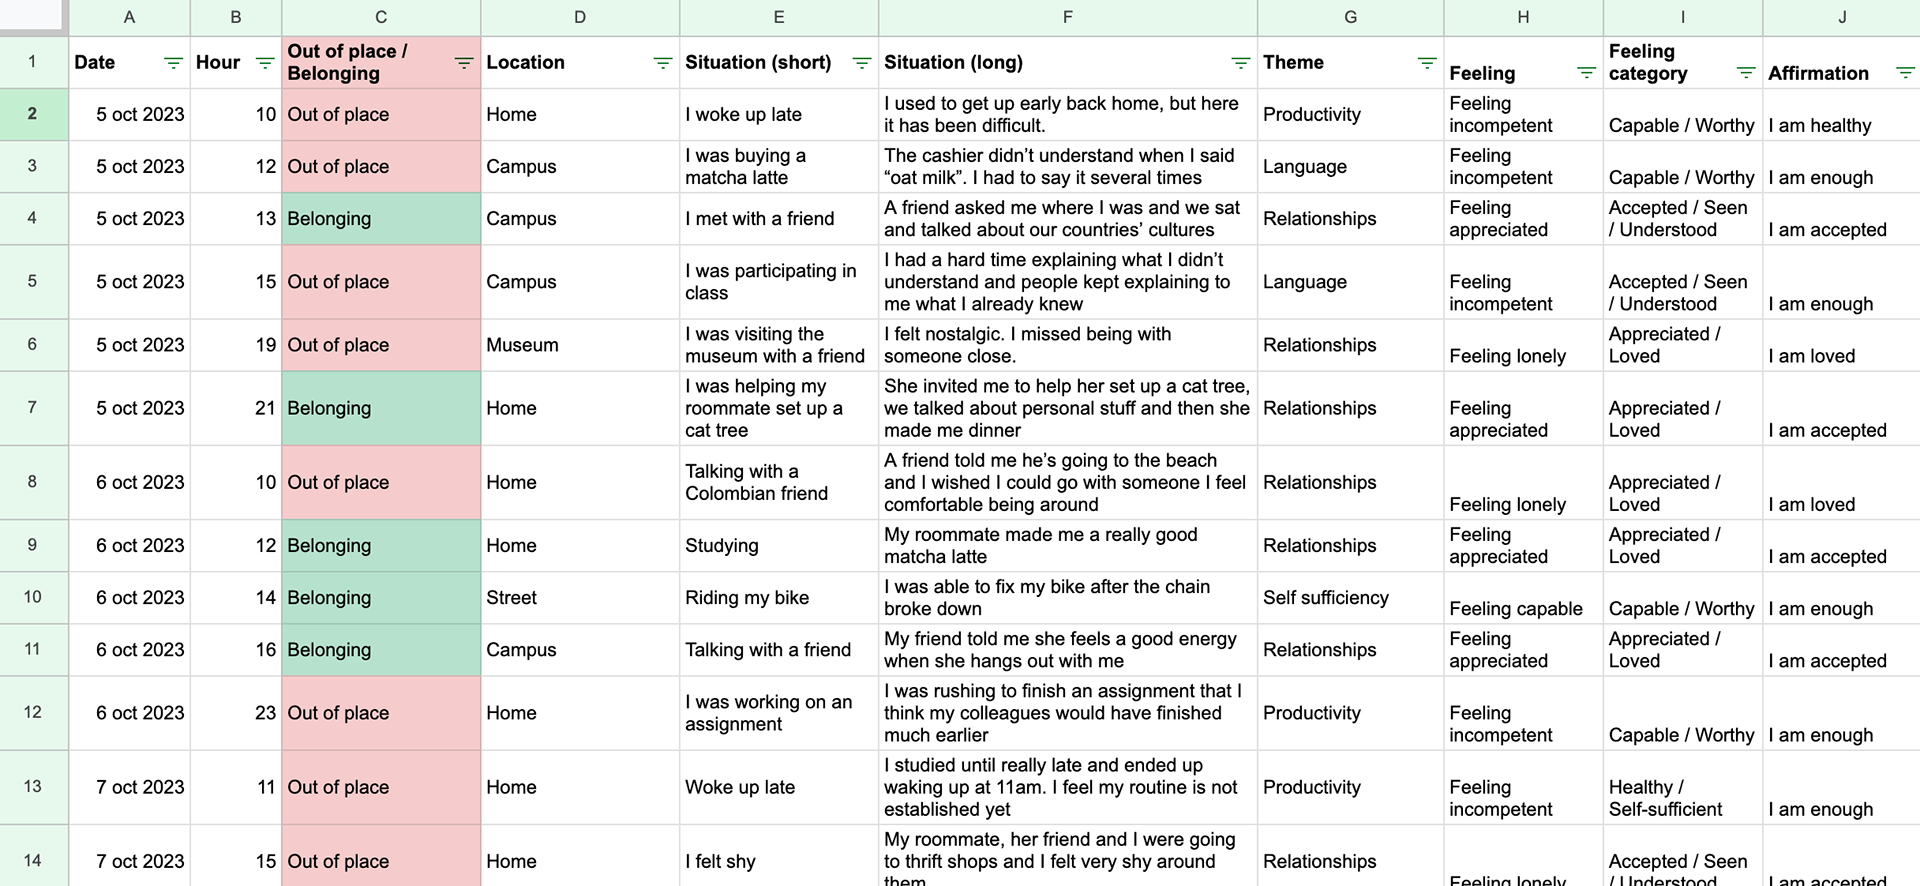
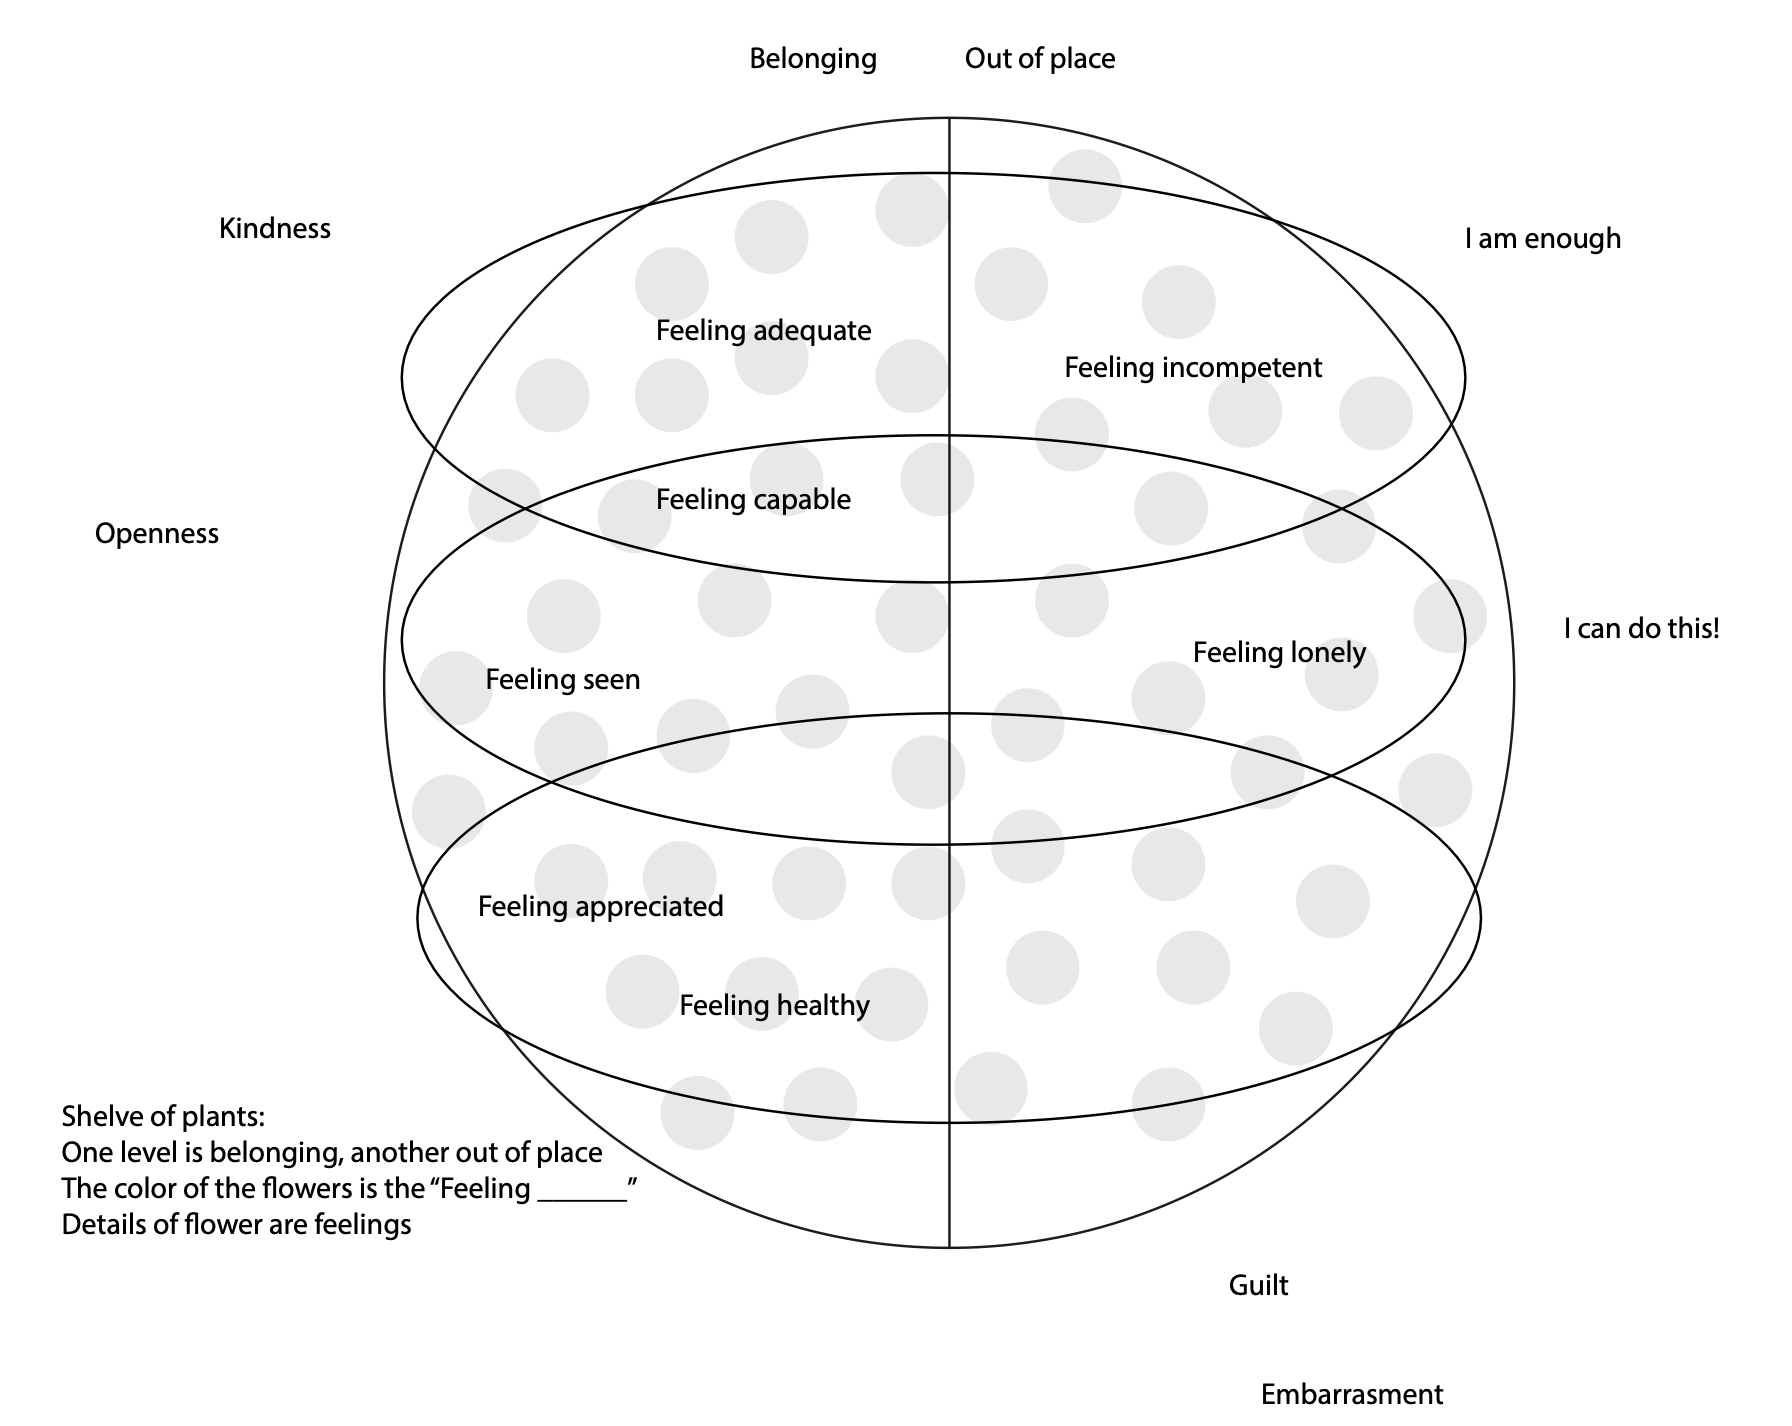
I registered and visualized my feelings of belonging and of being out of place in the city I had recently moved to.

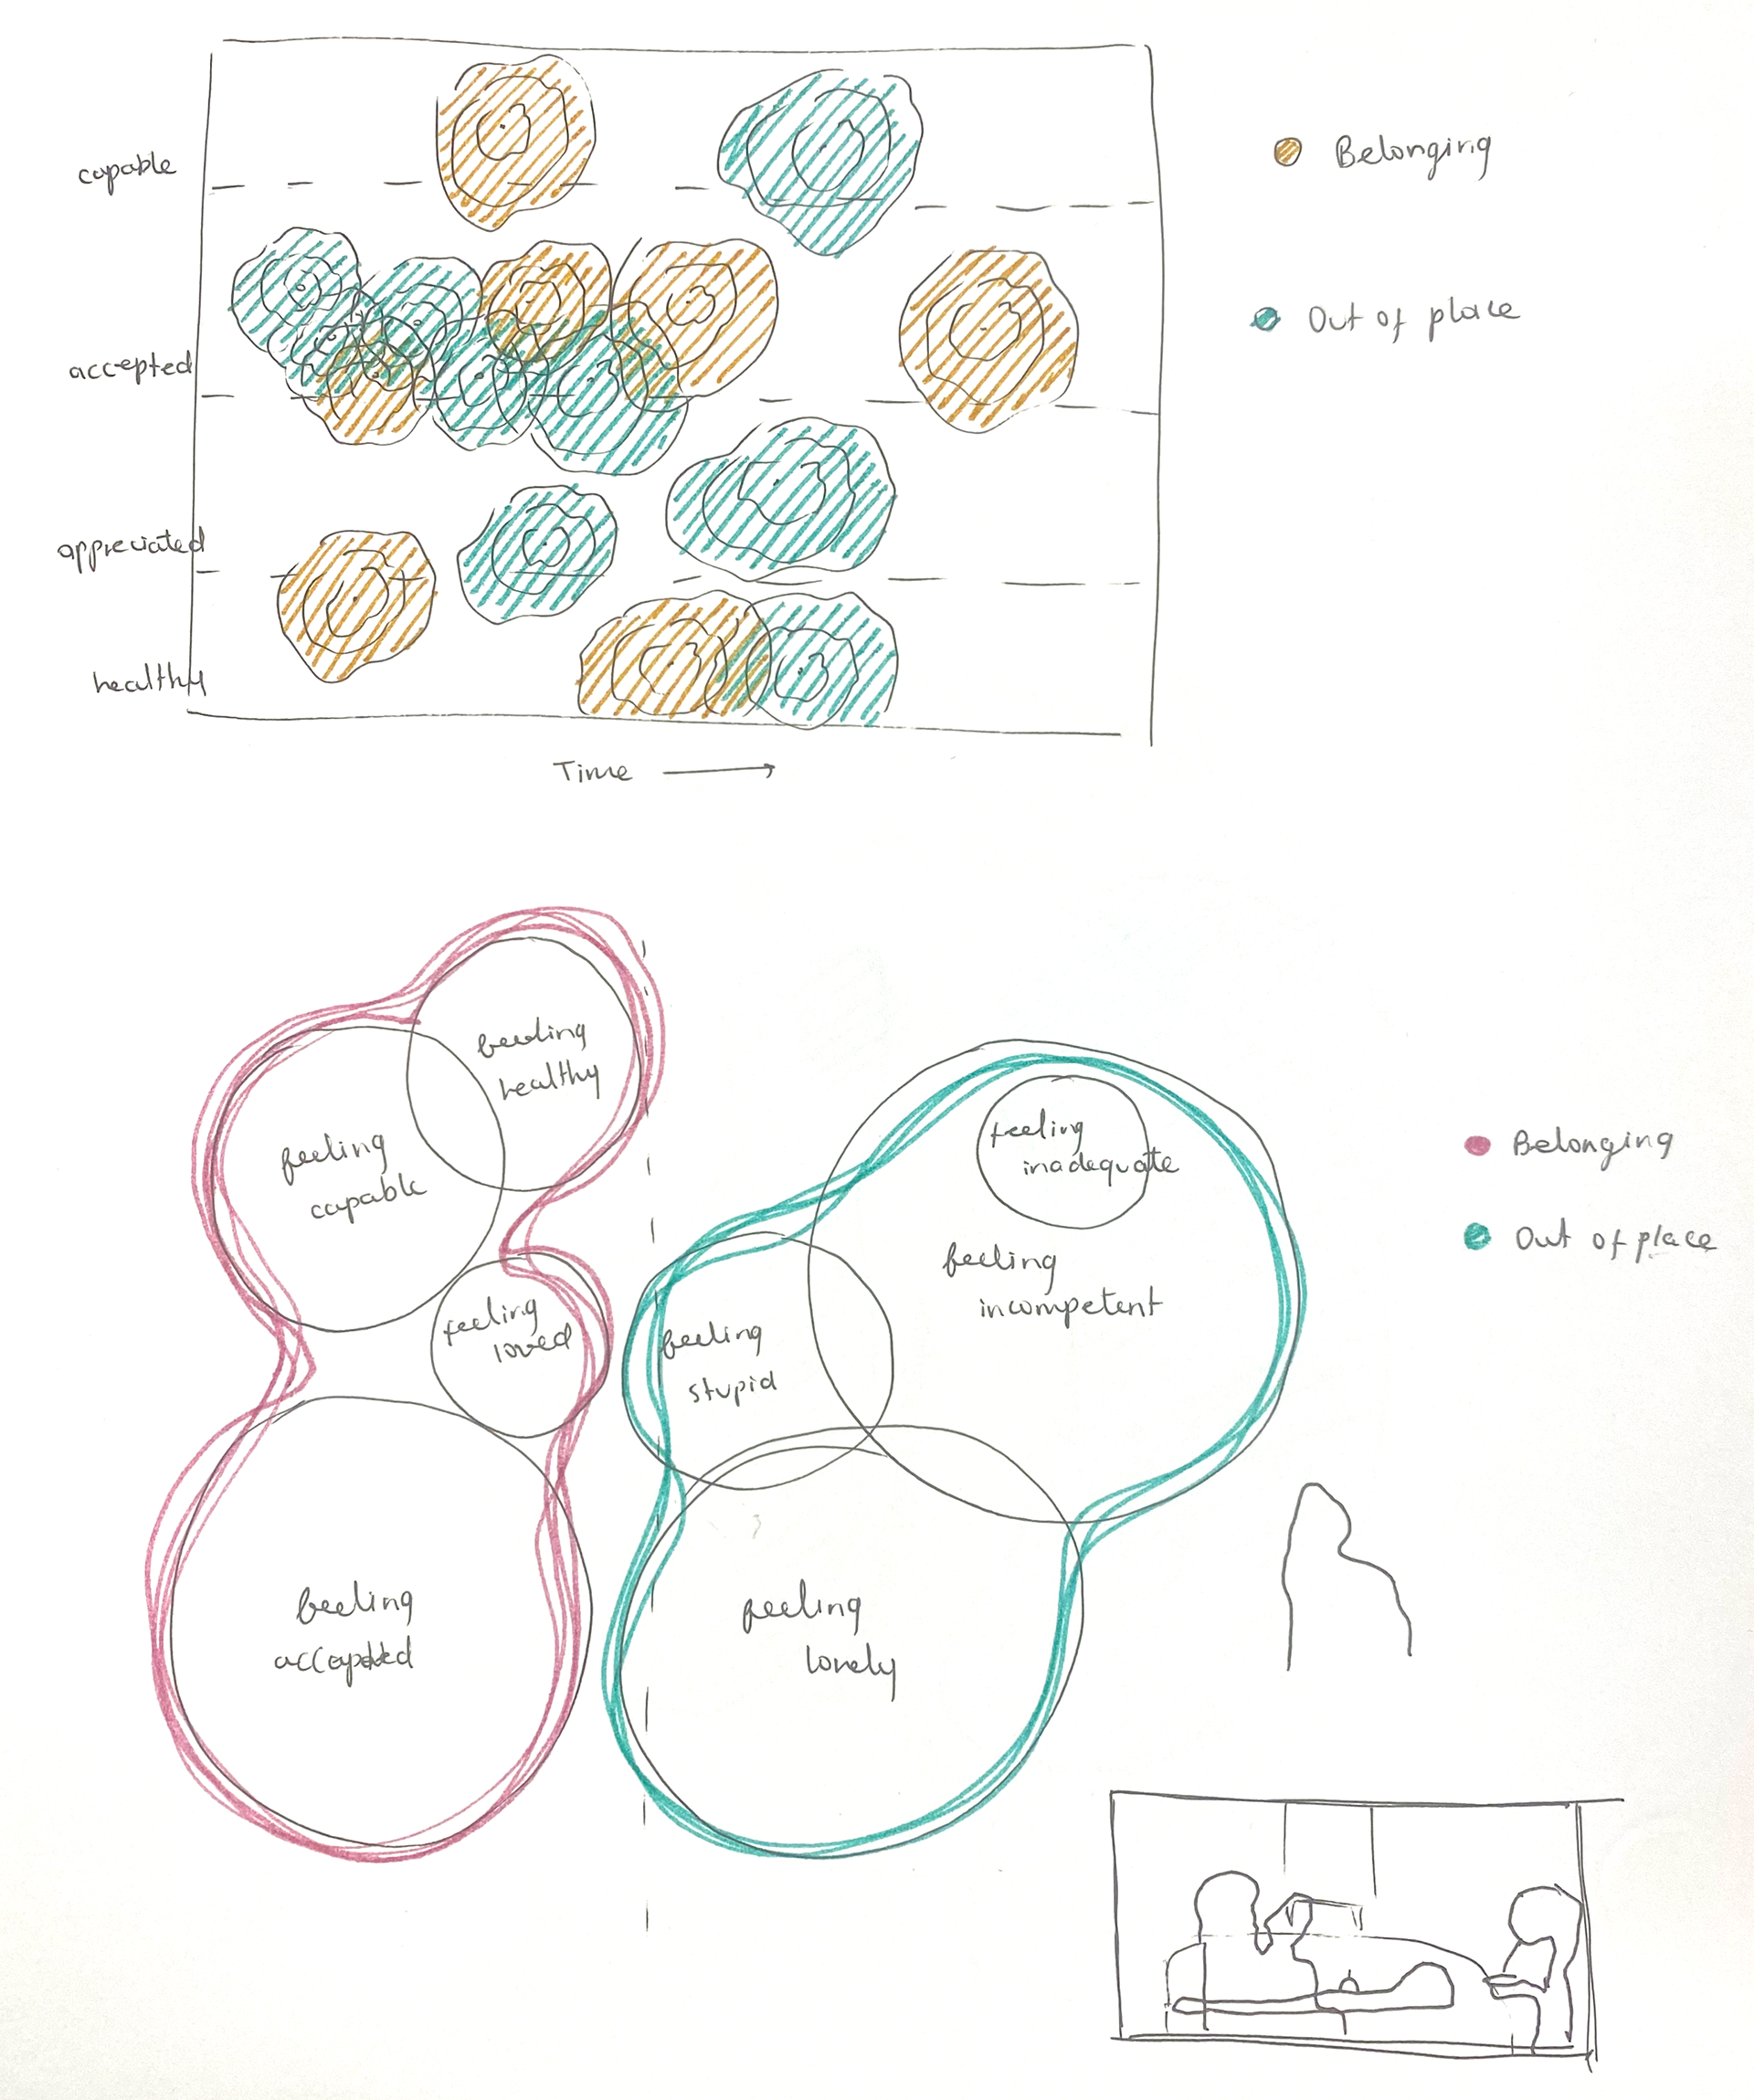
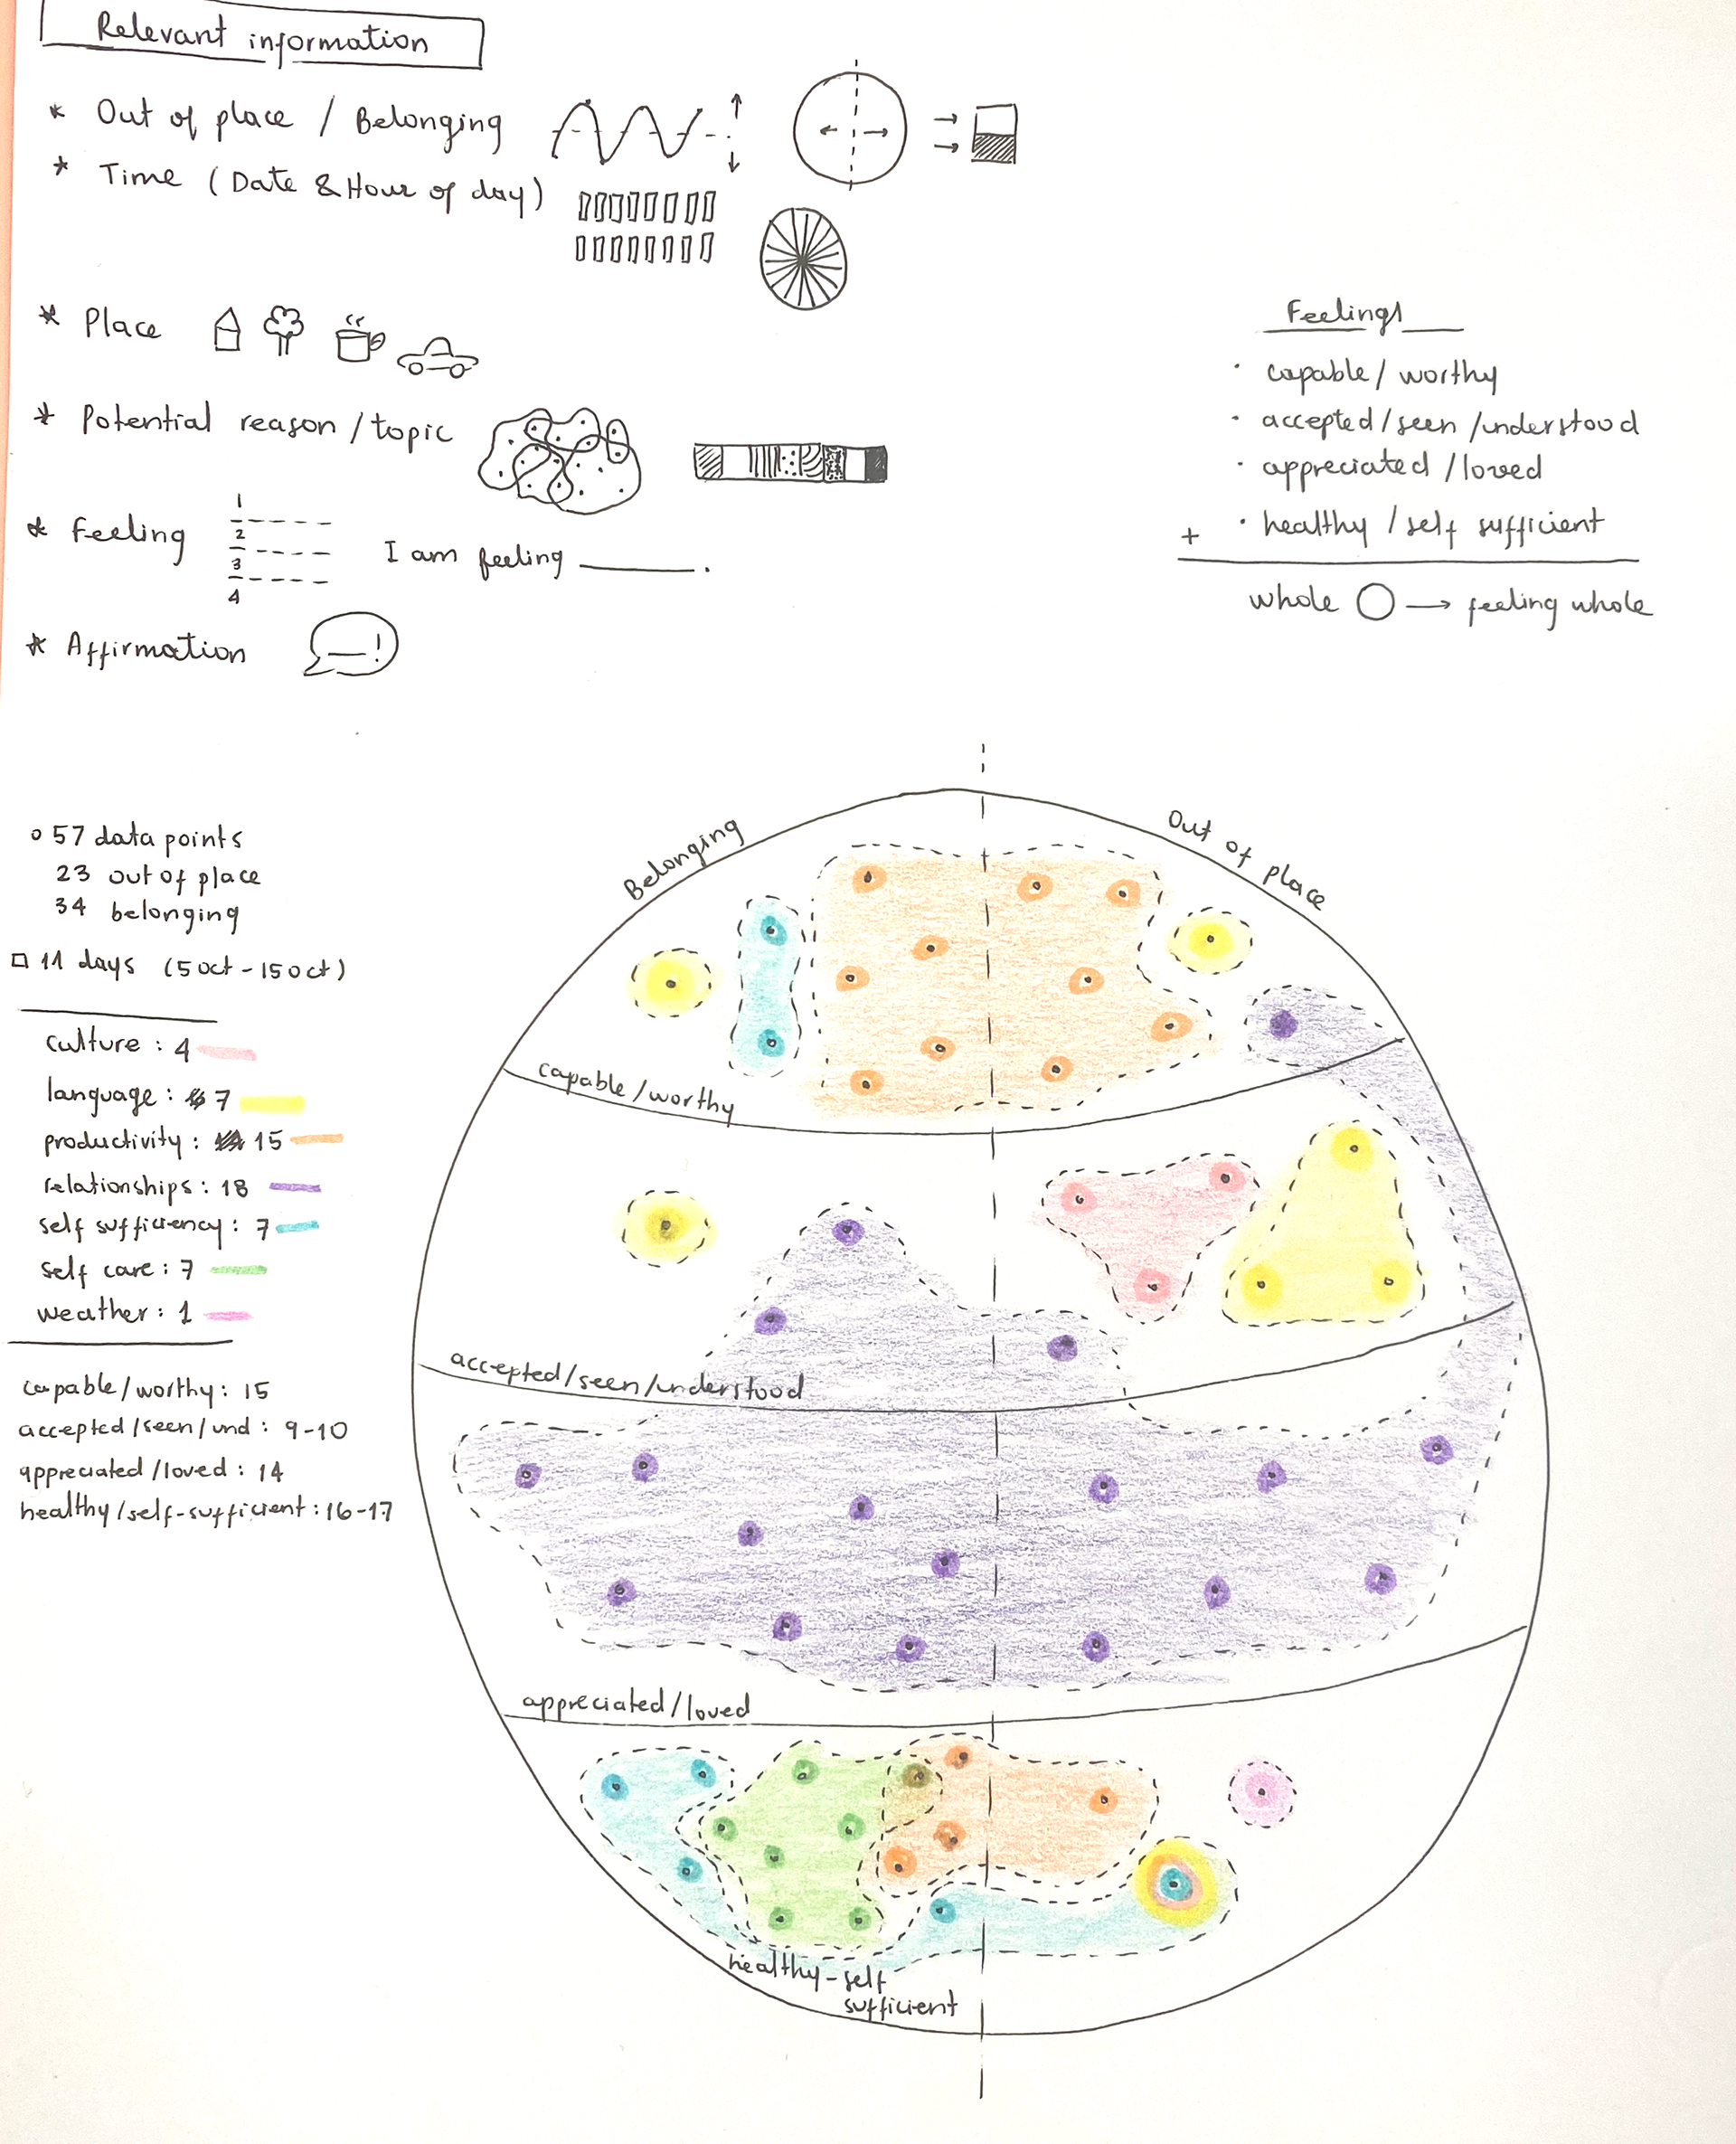
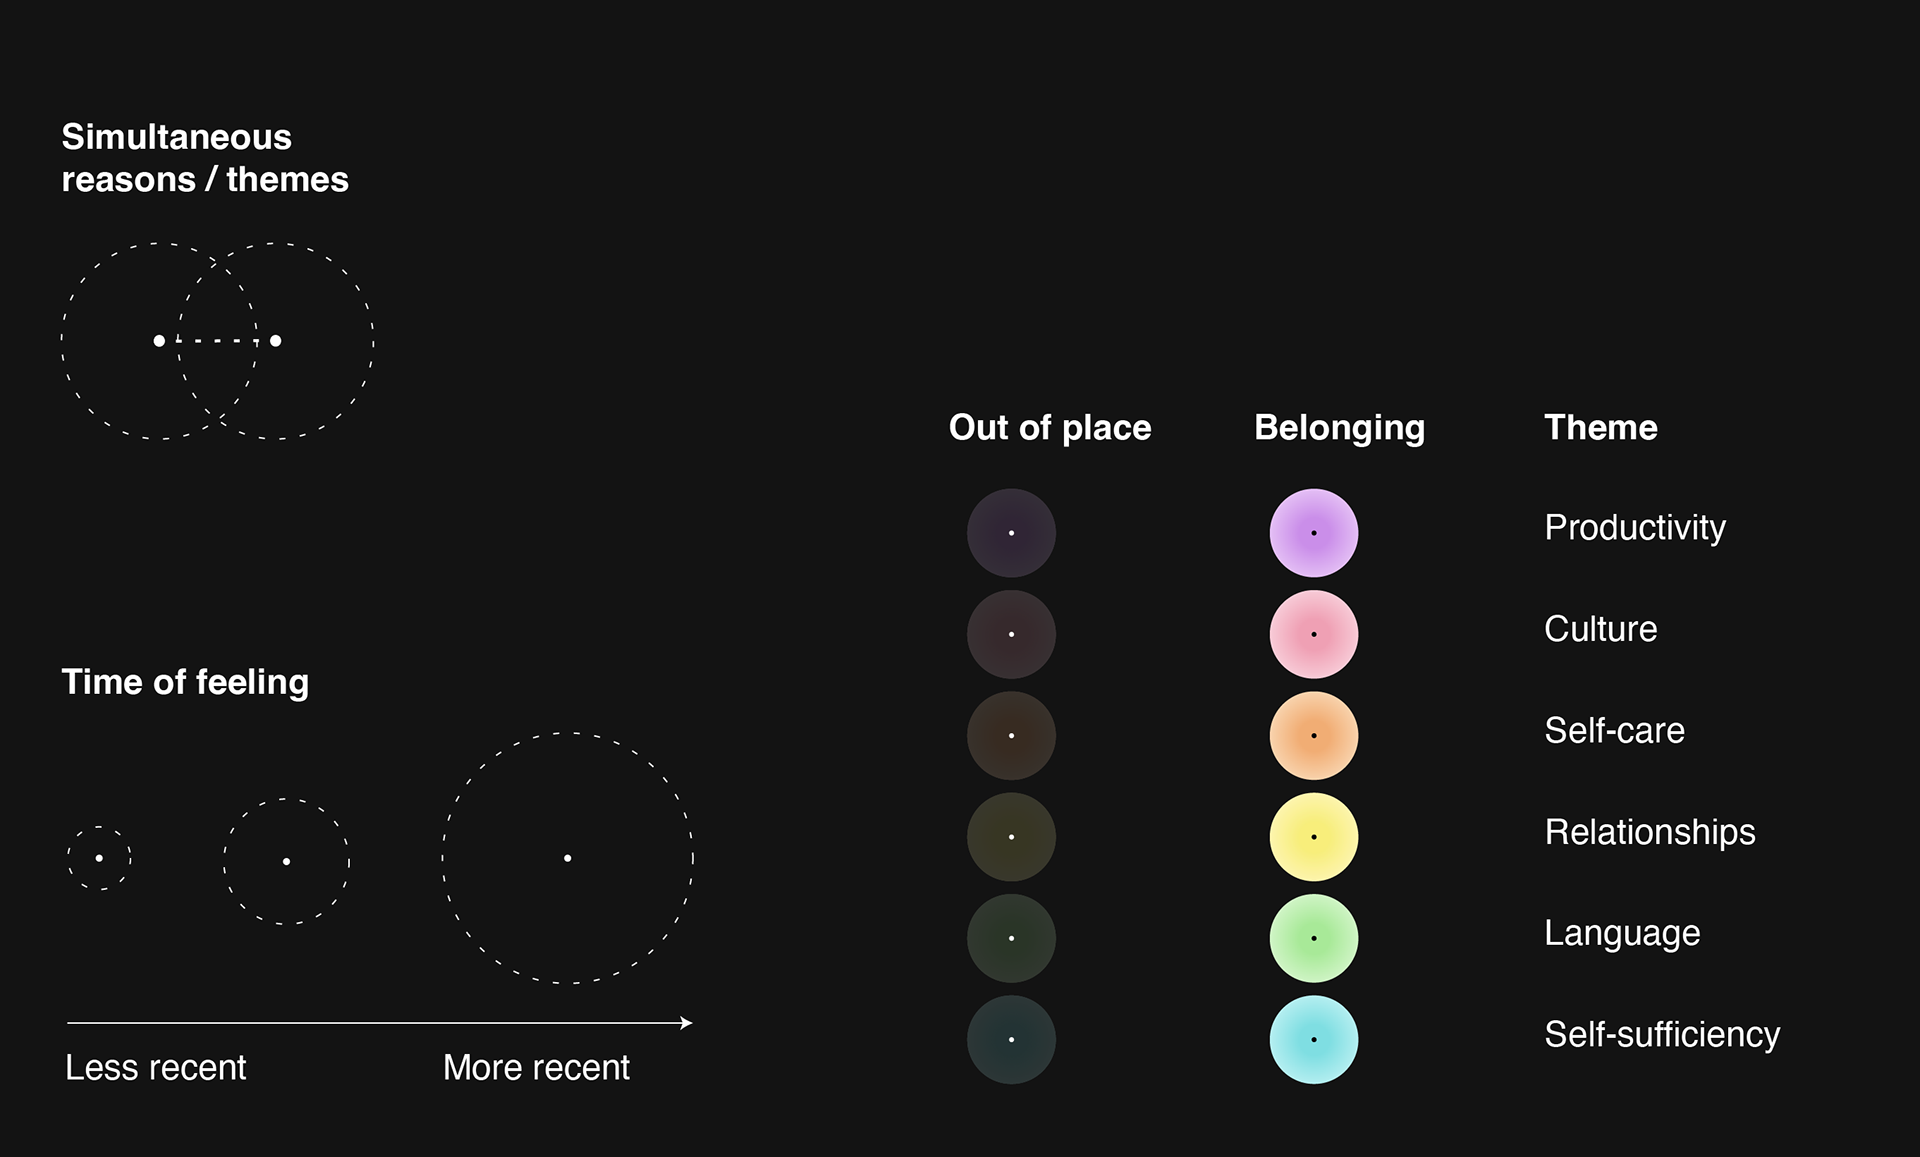
Feelings emerged around certain themes, which I encoded through color hue. The size of the bubbles convey the predominance of the feelings, which faded with time.
Data collection
For two weeks, I registered my feelings and the situations that originated them on a table, categorizing them according to six themes: productivity, culture, self-care, relationships, language, and self-sufficiency.
Sketching
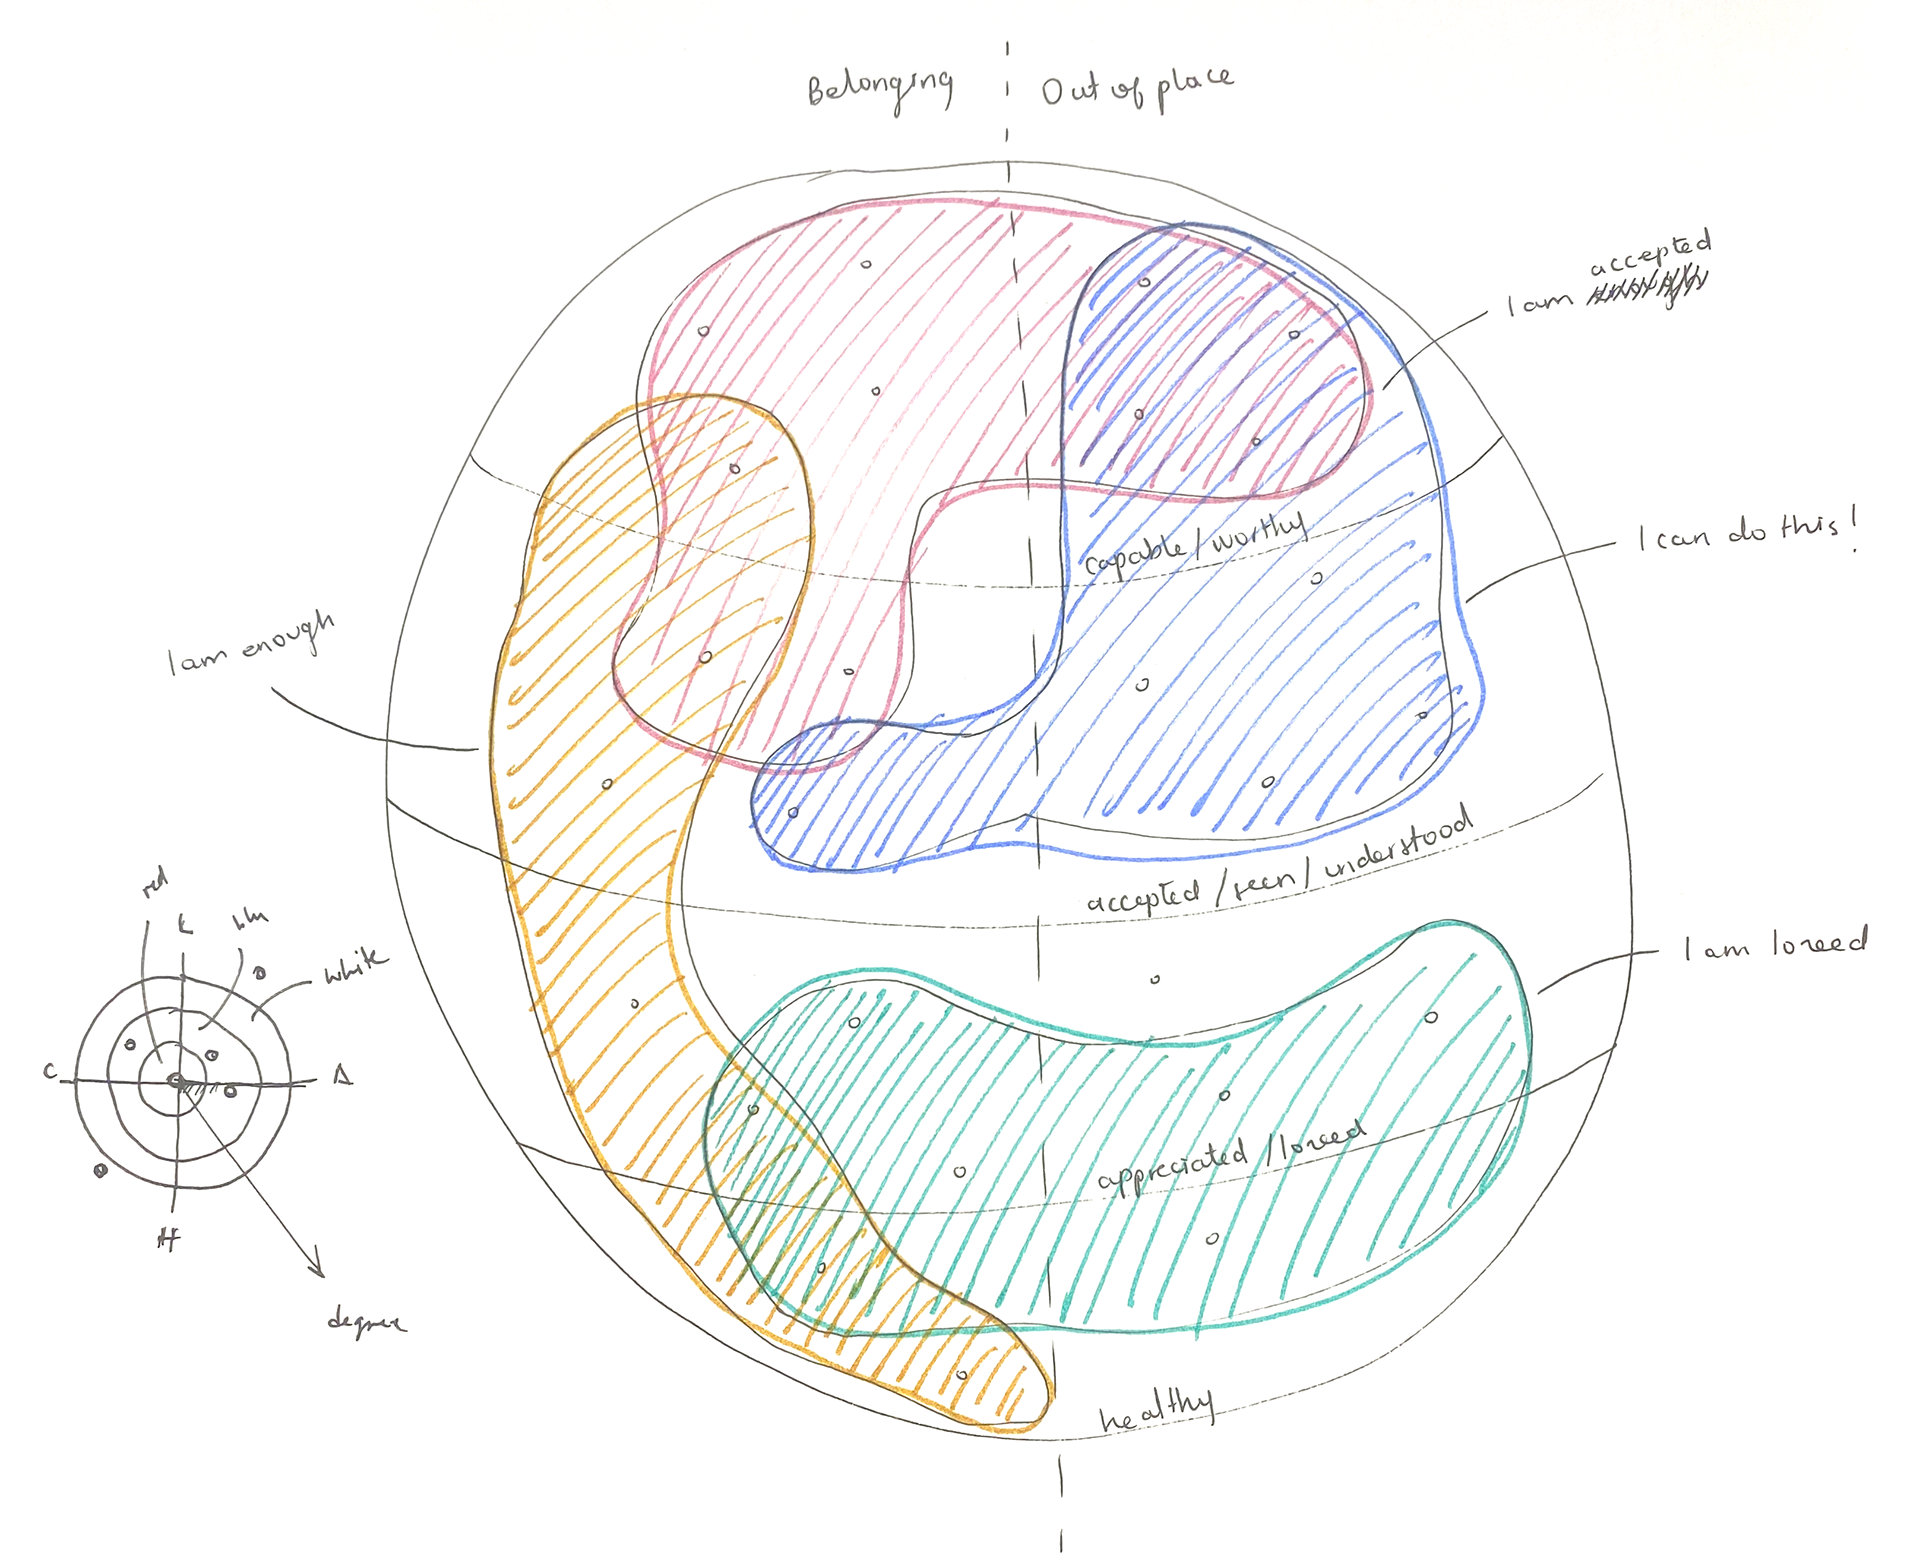
Once I had the data, I experimented with ways of visualizing it. I focused on visually distinguishing the difference between situations that made me feel like I belonged and situations in which I felt out of place.
Final version
After several rounds of feedback, I opted for a dark background to underscore the difference in color intensity between feelings of belonging and feeling out of place.

Credits
This project was created for the course Information Design Studio 1 with Professor Ashley Treni.
This project was created for the course Information Design Studio 1 with Professor Ashley Treni.